
What is the Adsorption breakthrough curve
Gas adsorption and separation process is a mixture of gases through the adsorption tower (also known as adsorber) filled with adsorbent to achieve the separation or purification of components; where the adsorption tower has fixed bed, moving bed and fluidized bed and other structural forms. Fixed bed is the most widely used form of adsorption tower filling in industry, in which the adsorbent is compacted and filled in the bed, with the advantages of simple structure, easy processing and flexible operation, etc. Fixed bed adsorption separation is the basis for a variety of different adsorption separation processes.
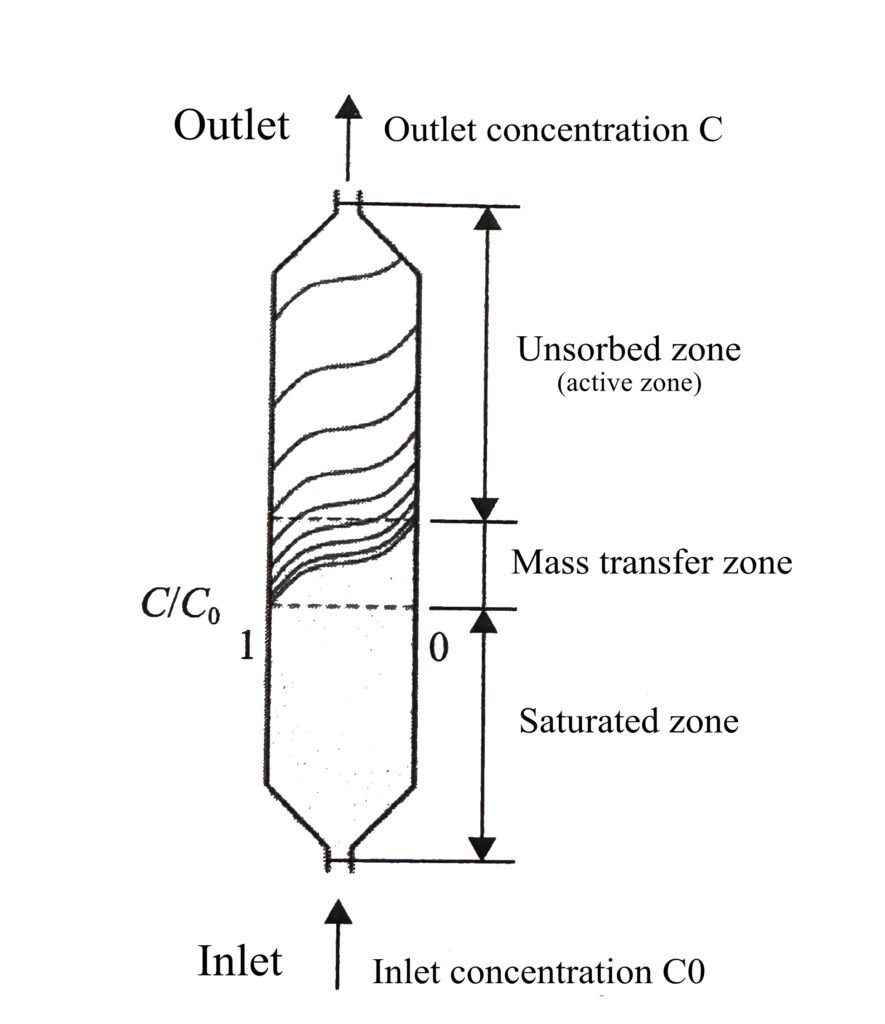
In the adsorption bed, when the mixed gas flows continuously and steadily through the adsorption bed, only weakly adsorbed components (such as low boiling point gases) flow out at the outlet end at first, while most of the strongly adsorbed components (such as polar molecules) are adsorbed at the inlet of the bed. Due to the existence of diffusion resistance within the adsorbent particles, adsorbate molecules are gradually adsorbed down and manifested as the concentration of adsorbate in the gas phase within the bed gradually changes from large to small toward the bed outlet, forming an S-shaped curve, and this curve of adsorbate concentration in the bed with time and position is called the loading curve, also known as adsorption wave, adsorption band or adsorption front.
Meanwhile, in the area near the inlet, adsorbate has reached adsorption equilibrium in the adsorbent and is in the adsorption saturation zone, while the area at the outlet is in the unsorbed zone, and the zone between the adsorbent saturation zone and the unsorbed zone is called mass transfer zone (MTZ), as shown in Figure 1.
After the saturation of adsorption at the inlet of the bed, the mass transfer zone of the adsorbate component moves forward into the unsorbed zone; as time passes, the mass transfer zone gradually moves toward the outlet, as shown in Figure 2.
In addition, it can be seen from Figure 2 that when the front end of the adsorption wave (i.e., the highest concentration of adsorbate allowed in the exit gas) reaches the outlet of the bed, i.e., after reaching the breakthrough point C3 of this adsorption process, the concentration of adsorbate in the gas flowing out of the bed starts to rise rapidly until the concentration of the gas flowing out is the same as the inlet concentration; So the curve of the adsorbate concentration in the outlet of the adsorption bed changes with time and reaches the concentration of the feed gas is called the breakthrough curve (also called the trans-effect curve or outflow curve).
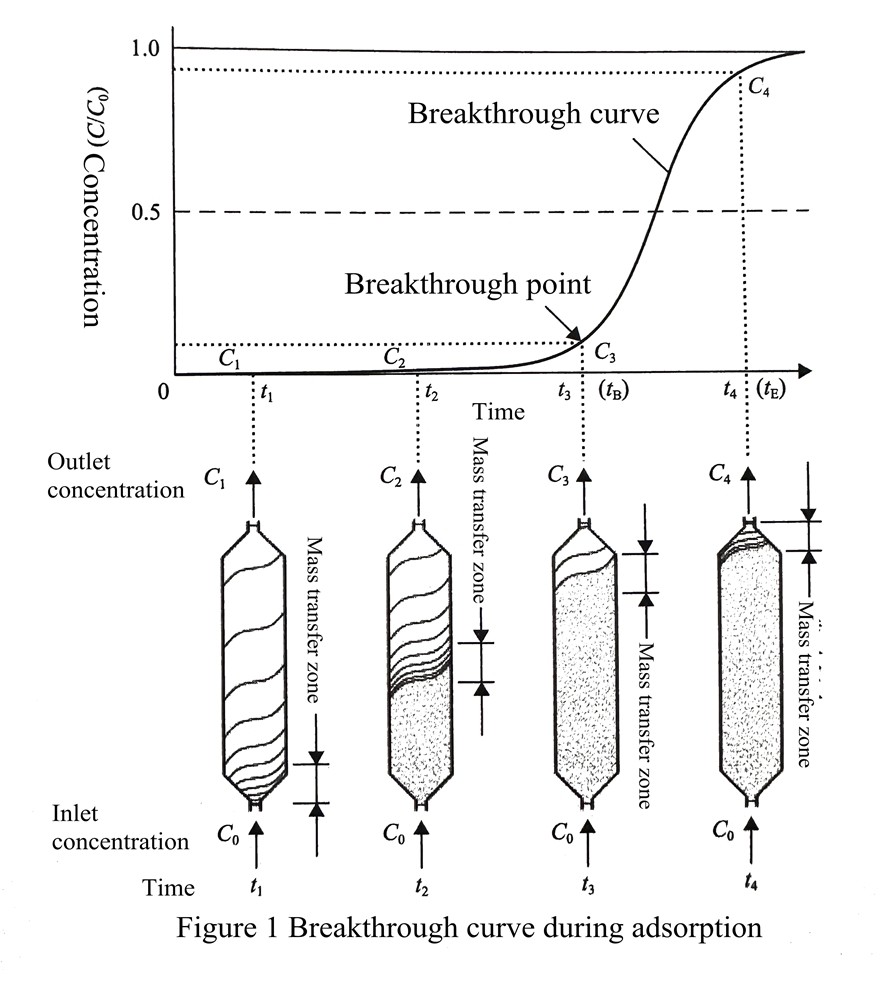
In the actual adsorption separation process design, the adsorption should be stopped before the breakthrough curve reaching the breakthrough point, and the cycle step switching of the adsorption process should be carried out to prevent the output product gas from being contaminated by strong adsorbate gas. At the same time, when the breakthrough point is reached, the whole adsorption bed includes adsorption saturation zone and mass transfer zone, is not completely saturated, and the shorter (or the steeper) the mass transfer zone it is, the better the adsorption performance; the shape of the loading curve of the bed and the breakthrough curve will be mirror-like symmetry. The adsorption breakthrough curve can be used to evaluate the adsorption separation performance of the adsorbent and as a basis for adsorption separation process design.